A) the consumer does not prefer more to less.
B) the consumer is likely to prefer a redistribution of income from rich to poor.
C) different individuals have different preferences for the same goods.
D) the marginal rate of substitution is the same for both indifference curves.
F) B) and D)
Correct Answer

verified
Correct Answer
verified
Multiple Choice
Good X is an inferior good but not a Giffen good.When the price of X increases,the consumer will consume
A) more X.
B) the same amount of X.
C) less X.
D) more or less X depending on the size of the income effect relative to the size of the substitution effect.
F) B) and C)
Correct Answer

verified
Correct Answer
verified
True/False
A rational person can have a negatively-sloped labor supply curve.
B) False
Correct Answer

verified
Correct Answer
verified
Multiple Choice
Mark spends his weekly income on gin and cocktail olives.The price of gin has risen from $7 to $9 per bottle,the price of cocktail olives has fallen from $6 to $5 per jar,and Mark's income has stayed fixed at $46 per week.Since the price changes,Mark has been buying 4 bottles of gin and 2 jars of cocktail olives per week.At the original prices,4 bottles of gin and 2 jars of cocktail olives would have
A) exactly exhausted his income.
B) cost more than his income.
C) cost less than his income.
D) could have maximized his satisfaction given his budget constraint.
F) A) and C)
Correct Answer

verified
Correct Answer
verified
Multiple Choice
Andi uses all of her income to purchase books and games.At any two points A and B on Andi's budget constraint,
A) Andi is spending all of her income on books and games.
B) Andi is spending one half of her income on books and the other half of her income on games.
C) the price of books relative to the price of games is different.
D) All of the above are correct.
F) A) and B)
Correct Answer

verified
Correct Answer
verified
Multiple Choice
Figure 21-15 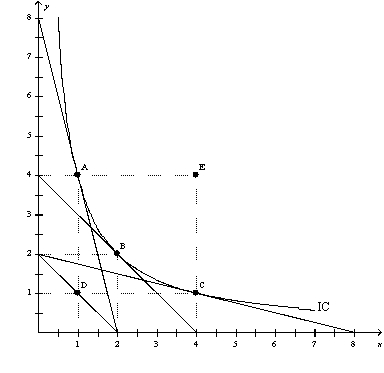 -Refer to Figure 21-15.The price of X is $20,the price of Y is $5,and the consumer's income is $40.Which point represents the consumer's optimal choice?
A) A
B) B
C) C
D) D
F) C) and D)
Correct Answer

verified
Correct Answer
verified
Multiple Choice
You can think of an indifference curve as an
A) equal-cost curve.
B) equal-marginal-cost curve.
C) equal-utility curve.
D) equal-marginal-utility curve.
F) None of the above
Correct Answer

verified
Correct Answer
verified
Multiple Choice
The substitution effect of an increase in the interest rate will result in an increase in
A) consumption when young and increase in savings when young.
B) consumption when old and an increase in savings when young.
C) consumption when young and an increase in savings when old.
D) savings when old and an increase in consumption when old.
F) A) and D)
Correct Answer

verified
Correct Answer
verified
Multiple Choice
Figure 21-8 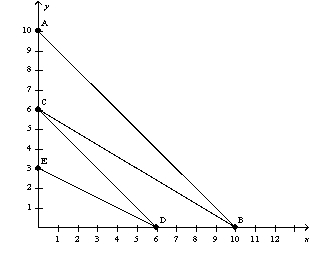 -Refer to Figure 21-8.You have $300 to spend on good X and good Y.If good X costs $30 and good Y costs $50,your budget constraint is
A) AB.
B) BC.
C) CD.
D) DE.
F) A) and D)
Correct Answer

verified
Correct Answer
verified
Multiple Choice
The goal of the consumer is to
A) maximize utility.
B) minimize expenses.
C) spend more income in the current time period than in the future.
D) All of the above are the goals of the consumer.
F) A) and D)
Correct Answer

verified
Correct Answer
verified
Multiple Choice
Which of the following examples would illustrate a backward-sloping labor supply-curve?
A) An increase in a person's wages results in the person working fewer hours per week.
B) A decrease in a person's wages results in the person working more hours per week.
C) An increase in a person's wages results in the person working more hours per week.
D) Both a and b are correct.
F) A) and B)
Correct Answer

verified
Correct Answer
verified
Multiple Choice
Suppose that Elmer's hourly wage increases,and he decides to work fewer hours.For Elmer,the substitution effect of the wage change is
A) only partially offset by the income effect.
B) more than offset by the income effect.
C) exactly offset by the income effect.
D) We do not have enough information with which to answer the question.
F) B) and C)
Correct Answer

verified
Correct Answer
verified
Multiple Choice
The opportunity cost of current household consumption is the
A) wage rate.
B) market interest rate.
C) price of the goods consumed.
D) explicit cost of consumption.
F) A) and C)
Correct Answer

verified
Correct Answer
verified
Multiple Choice
If we observe that a consumer's budget constraint has shifted inward,we can assume that the consumer will buy
A) fewer normal goods and more inferior goods.
B) more normal goods and fewer inferior goods.
C) more normal goods and more inferior goods.
D) fewer normal goods and fewer inferior goods.
F) A) and C)
Correct Answer

verified
Correct Answer
verified
Multiple Choice
Which effect of a price change moves the consumer along the same indifference curve to a point with a new marginal rate of substitution?
A) the budget effect
B) the preference effect
C) the substitution effect
D) the income effect
F) A) and B)
Correct Answer

verified
Correct Answer
verified
Multiple Choice
Figure 21-14 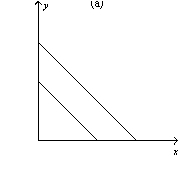
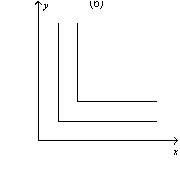
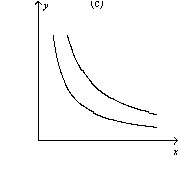 -Refer to Figure 21-14.Which of the graphs shown represent indifference curves for perfect complements?
A) graph a
B) graph b
C) graph c
D) All of the above are correct.
F) All of the above
Correct Answer

verified
Correct Answer
verified
Essay
Answer the following questions based on the table.A consumer is able to consume the following bundles of rice and beans when the price of rice is $2 and the price of beans is $3.
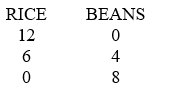 a.How much is this consumer's income?
b.Draw a budget constraint given this information.Label it B.
c.Construct a new budget constraint showing the change if the price of rice falls $1.Label this C.
d.Given the original prices for rice ($2)and beans ($3),construct a new budget constraint if this consumer's income increased to $48.Label this D.
Correct Answer

verified
Correct Answer
verified
Multiple Choice
A budget constraint illustrates the
A) prices that a consumer chooses to pay for products he consumes.
B) purchases made by consumers.
C) consumption bundles that a consumer can afford.
D) consumption bundles that give a consumer equal satisfaction.
F) None of the above
Correct Answer

verified
Correct Answer
verified
Multiple Choice
Figure 21-1 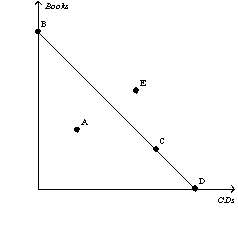 -Refer to Figure 21-1.Which point in the figure showing a consumer's budget constraint represents the consumer's income divided by the price of a CD?
A) point A
B) point C
C) point D
D) point E
F) A) and C)
Correct Answer

verified
Correct Answer
verified
Multiple Choice
Giffen goods have positively-sloped demand curves because they are
A) normal goods for which the income effect outweighs the substitution effect.
B) normal goods for which the substitution effect outweighs the income effect.
C) inferior goods for which the income effect outweighs the substitution effect.
D) inferior goods for which the substitution effect outweighs the income effect.
F) None of the above
Correct Answer

verified
Correct Answer
verified
Showing 61 - 80 of 492
Related Exams